Solutions by typeMobility analysis
How long is the wait right now, really?
A queue is not estimated. It is measured
Almost eleven at night in international arrivals. The switchback is full across all four legs and the queue disappears down the corridor: six hundred and twenty people. Of the twelve desks, seven are dark. The last person to join will take fifty-two minutes to reach the counter. Tomorrow, in the shift report, this will be written in three words: «there were queues».
36 cameras across 10 sectors
What IRIS is
IRIS watches the cameras for you.
IRIS Neural is an artificial intelligence that watches the cameras you already have and understands what happens in front of them. When something important happens —or something you told it you need to keep an eye on—, it alerts you; and whatever can be counted, it counts in numbers. All day long, without anyone having to watch a screen.
You tell it what you need to watch, and IRIS does it.
Works with the cameras you already have. Nothing to replace.
A person replies, not a form.
- Your footage never leaves your premises.
- It doesn't identify people.
- Certifications →
This is how you ask for it
«Alert me if the wait at the control goes over forty minutes while desks are still closed.»
«There were queues» is not something anyone can argue with. It does not say how many minutes, or when it started, or how many desks were open when it did. Without that number, the conversation with whoever sets the roster is one opinion against another, and it repeats itself next Tuesday at the same hour. Meanwhile, the person who waited fifty minutes does not complain at the desk: they complain online, and that review is timestamped.
You decide once
Here there is no sentence, there is a drawn zone. The organisation traces on the image where the queue starts and where it ends, and decides once how many minutes trigger the alert and who receives it. A line cannot be described in words: it has to be drawn. That is why the number comes out the same on a Tuesday and on a Sunday, and can be checked again on the same video. IRIS applies it on every shift without anyone repeating it.
The airport is the big example, but the same scene repeats in places that look nothing like it. In a bank branch there are five people standing behind the rope, one clerk serving, and a fully set-up desk — screen on, stationery in place — that has been empty for a quarter of an hour. In a Saturday food court, the queue at the first counter bends round the aisle at eleven minutes, while the third has a two-minute wait. In a hospital lobby, the reception desk is empty and people are waiting in front of it for somebody to come back.
In all those places there are two questions, and they are not the same one. The first is «is it happening now?», answered with an alert: the wait has crossed the limit and desks are closed. The second is «when does it always happen?», answered with a curve: the queue on Thursday at half past eight, the one on Saturday at twenty past two, the one on the first of every month. The first saves the afternoon. The second changes the roster, which is worth far more.
And one detail matters: the number does not depend on who is looking. It is the same measure every day, over the same drawn zone, and it can be checked again on the video. When the figure is arguable, the meeting argues about the figure. When it is not, it is about what to do.
What changes
This used to be eyeballed, or measured with a stopwatch for one week a year. The rest of the time, the data was whatever the person on shift felt.
Now the wait is a number measured all day, every day, and Thursday’s curve can sit next to last Thursday’s. Whoever argues for one more shift at eight no longer argues from an impression: they argue from the last eight weeks.
Where we have seen it
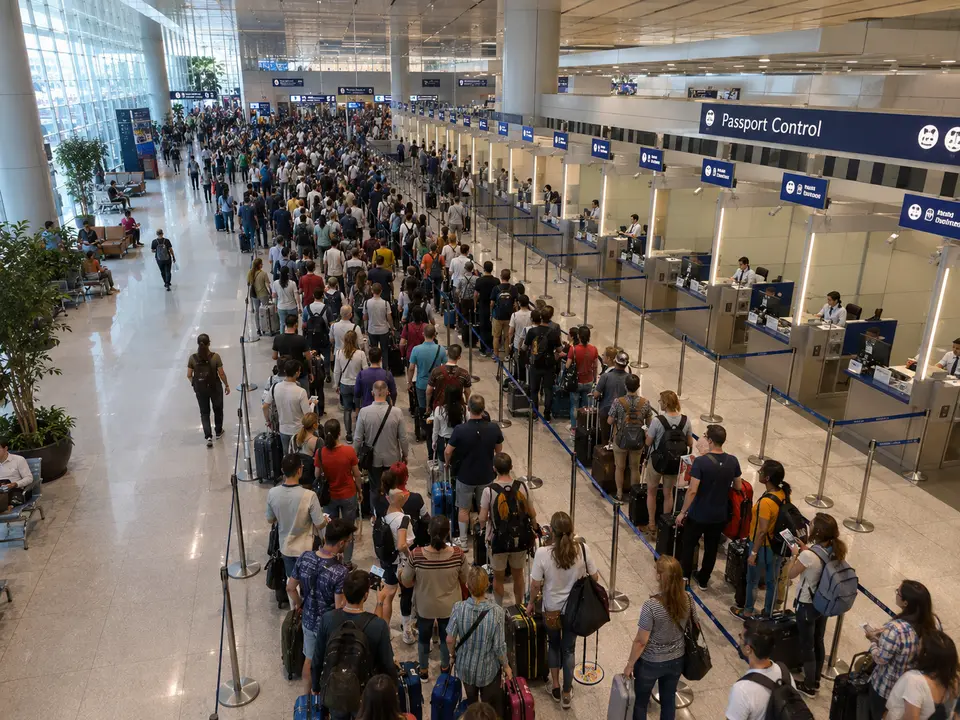
CAM-584Fifty-two minutes of queue and seven booths switched off
«Tell me if the control wait goes over forty minutes and there are booths still closed.»
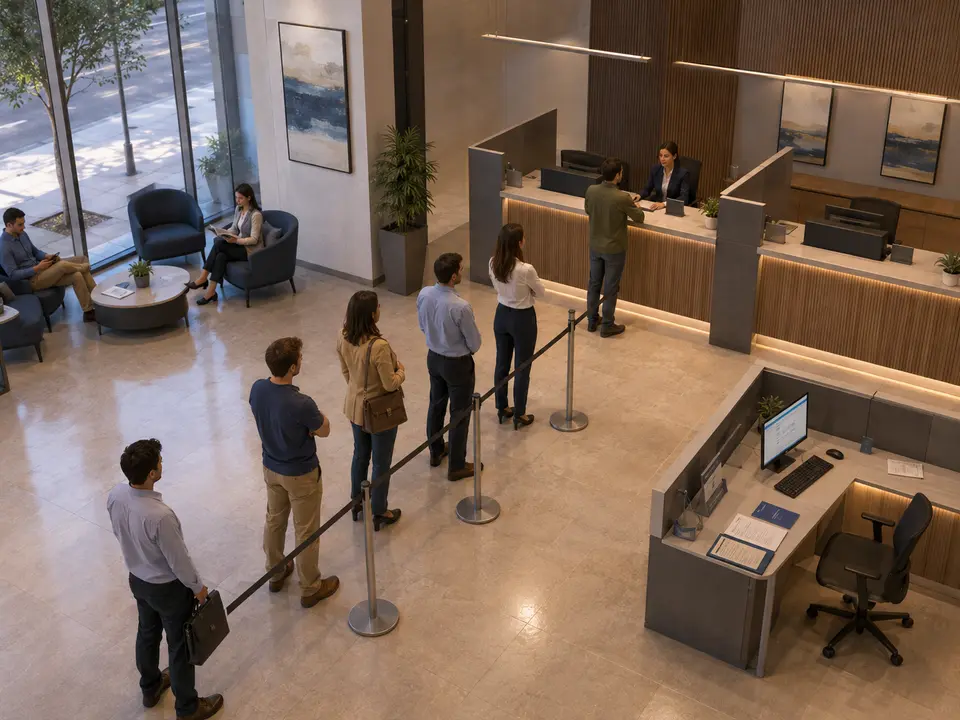
CAM-511Five people waiting and a desk set up with nobody at it
«Tell me when more than three people are waiting and a desk has been set up and empty for over fifteen minutes.»

CAM-527Three windows open, two dark, and the queue still waiting
«Tell me when more than ten people are waiting at the cage, or when the wait goes over eight minutes with windows still closed.»
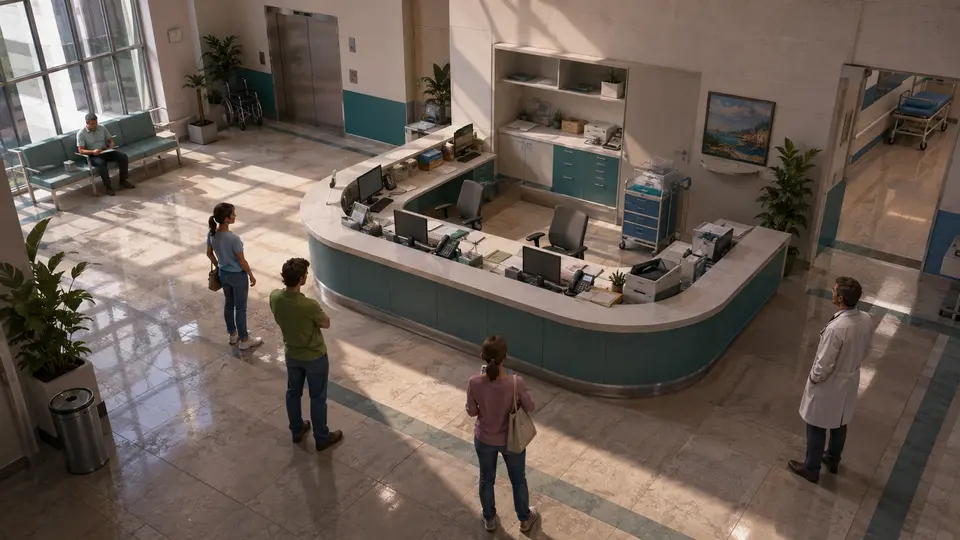
CAM-126Nobody behind the reception desk
«Tell me if the reception desk has nobody behind it for longer than we agreed, and above all if there are people waiting in front of it.»

CAM-498The breakfast room is full and the queue never gets past the host stand
«Tell me when more than ten people are waiting at the host stand, or when the buffet aisle has been impassable for five minutes.»

CAM-277The cold store standing open and the fish waiting outside
«Tell me how long the cold store door has been open and how long the pallets have been outside, and alert me if it goes past five minutes.»

CAM-541The queue is not moving and there are barely any free tables left
«Tell me if the wait at any unit goes over eight minutes or if there are fewer than ten free tables.»
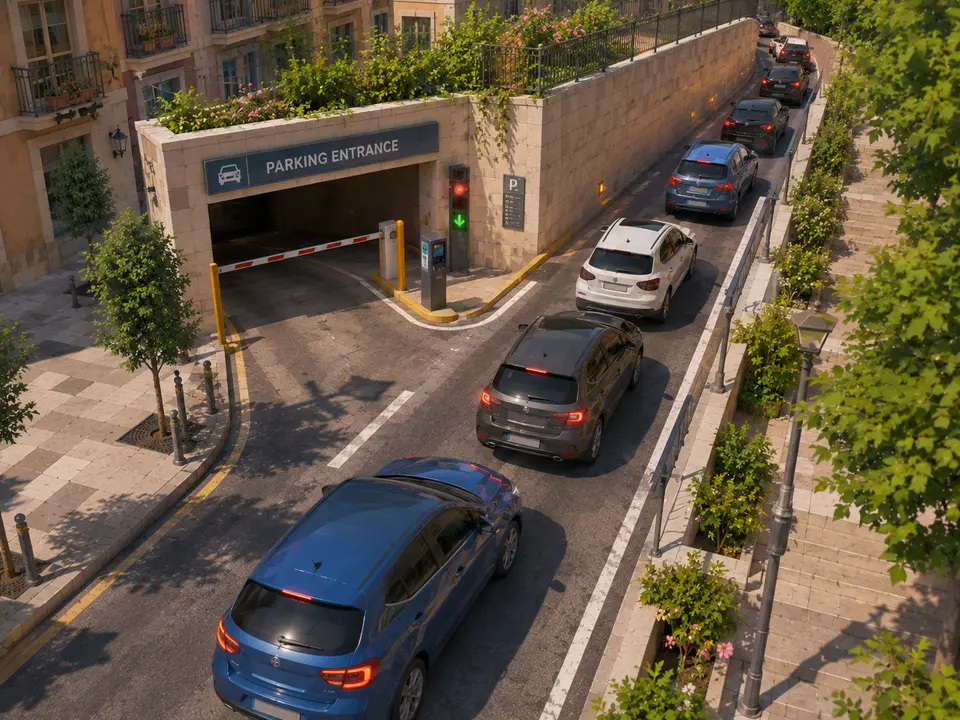
CAM-463Six cars waiting and the queue is already out on the street
«Tell me when more than five cars are waiting on the ramp, and how long the last one has been there.»
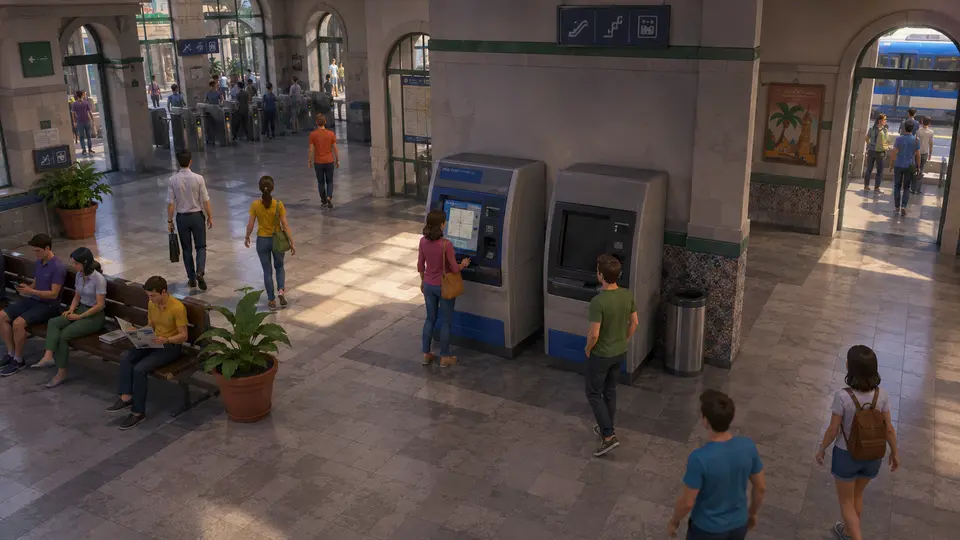
CAM-90Ticket machine out of order
«Tell me if a ticket machine stops being used while the one next to it has a queue.»
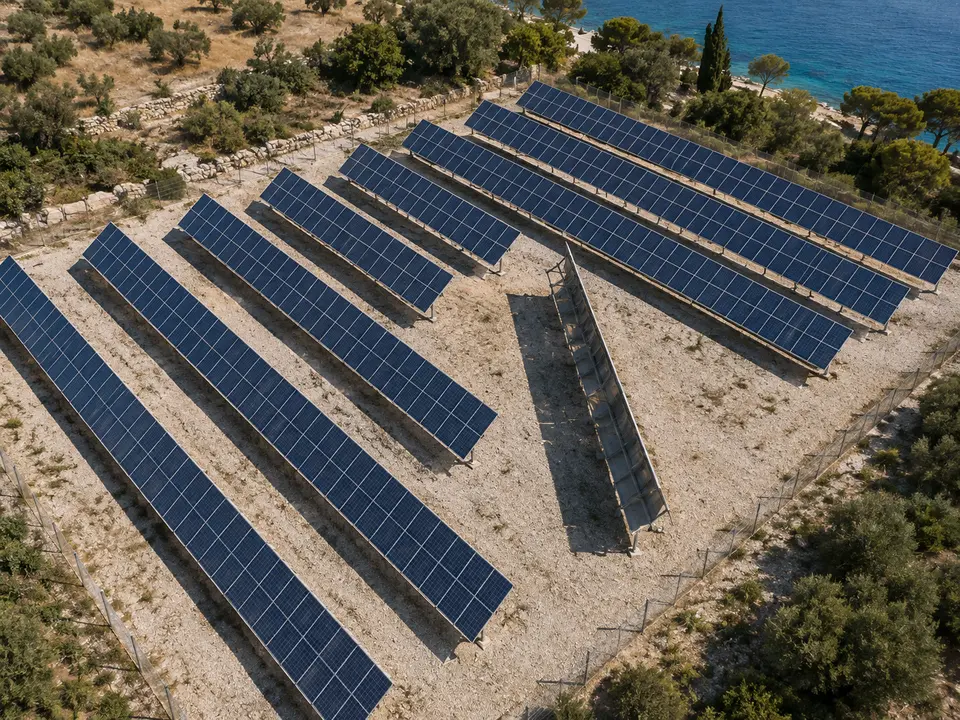
CAM-359One tracker row is facing the opposite way to all the others
«Tell me if any tracker row stays at a different orientation from its neighbours for more than an hour.»


What it does not do
IRIS does not shorten the queue: it shows it. It does not know why one desk is slow and it does not judge the person serving: it does not look at people one by one.
It counts how many people are inside the drawn zone and how long they take to leave. Opening another window or leaving things as they are remains the organisation’s decision, and it has to stay that way.
Questions
- How can it measure someone’s wait if it does not identify them?
- Because it does not need to know who anyone is. The wait comes from flow: how many people are inside the drawn zone and how fast they are leaving at the front. With those two figures you know how long the last person to join will take, the same way you work out how long a tank takes to empty. No faces, no names and no following individuals: a zone, an entry count and an exit count.
- Do we need new cameras?
- Not always, and it hinges on one thing: whether the camera already in place sees the whole queue and sees it from above. A security camera facing the counter is fine for seeing who is there, but not for counting the line, because people hide one another. Counting needs a high, clean view over the waiting area. In many places that already exists; in others it is one extra camera, not a new installation.
- Is the data good enough to set rosters and staffing?
- Yes, and it is its best use. The daily alert saves an afternoon; the eight-week curve changes the roster. With the wait measured by time band you can see when it really starts to climb, how long it takes to fall after opening one more desk, and which days behave unlike the rest. That turns a boardroom argument into a chart everyone can look at, and the conversation becomes what to do, not whether the queue was long.
- What if the queue turns the corner and leaves the frame?
- Then the number falls short, and that should be said upfront rather than afterwards. What is not seen is not counted: if the line leaves the frame, the measured wait is the wait for the visible part. There are two normal fixes: chaining the neighbouring camera so the zone continues, or choosing a camera position that covers the worst day rather than the average one. It is an installation decision, taken at the start.
A different case every time
Watch what happens. Then watch what IRIS does with it.
Not a recorded video and not a drawing: it is a summary of the real tool, with a different case each time round. The whole tool does not fit in a box.
- You ask
- IRIS searches
- It shows you
Not seeing yours here?
These words are the ones we have built, not the ones IRIS understands. The list falls short on purpose: you ask for it in a sentence, and sentences do not run out. Tell us what is in front of your cameras and we will tell you whether it understands it, or not yet.
And the best part
Ten cameras or four thousand:not one of them goes unwatched.
The day IRIS starts, they all start: the ten in a school or the four thousand in a whole network. And it only raises its hand when the thing you asked for happens.
Tell us your problem and we will say whether IRIS understands it, or not yet.
We reply the same working day.